# 交互提示ToolTips
对常用的ToolTips进行了整理,适用于web端和小程序端,引用方式见引导-使用ToolTips。
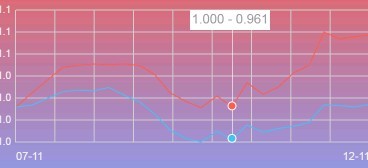
# 基础提示框BasicToolTip

- npm:
fundcharts/tooltips/grid - 适用图表:Line/Bar
- 参数:如下表
| toolTip字段/说明 | 默认值 | 格式 | 说明 |
|---|---|---|---|
| width | 70 | number | 提示框整体宽度 |
| height | 20 | number | 提示框整体高度 |
| font | 10px Arial | string | 文案样式 |
| color | #fff | string | 文案颜色 |
| textAlign | center | string | 文案对齐 |
| backgroundColor | #bdbdbd | string | 背景颜色 |
| showTip | '' | Function/string | 控制展示,函数时传参为xaxis数据和对应datas。(xData: string, yDatas: number[]) => {} |
如:
const _data1 = [1, 2, 3, 4, 3.5, 3, 4],
    _xaxis1 = ['1-11', '2-11', '3-11', '4-22', '5-11', '6-11', '7-11'];
let chart1 = new LineChart({
    id: 'line1',
    xaxis: _xaxis1,
    data: _data1,
    hover: BasicToolTip,		// BasicToolTip 来自 fundchart-tooltips.js
	toolTip: {					// toolTip配置
		color: '#f00'
	}
});

chart1.init();
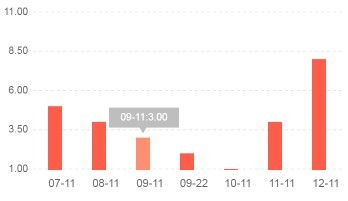
# 箭头提示框ArrowToolTip

- npm:
fundcharts/tooltips/grid - 适用图表:Line/Bar
- 参数:如下表
| toolTip字段/说明 | 默认值 | 格式 | 说明 |
|---|---|---|---|
| width | 70 | number | 提示框整体宽度 |
| height | 20 | number | 提示框整体高度 |
| font | 10px Arial | string | 文案样式 |
| color | #fff | string | 文案颜色 |
| textAlign | center | string | 文案对齐 |
| backgroundColor | #bdbdbd | string | 背景颜色 |
| top | 12 | number | 提示框与数据点的距离 |
| showTip | '' | Function/string | 控制展示,函数时传参为xaxis数据和对应datas。(xData: string, yDatas: number[]) => {} |
如:
const chart1 = new BarChart({
    id: 'bar1',
    xaxis: ['07-11', '08-11', '09-11', '09-22', '10-11', '11-11', '12-11', '12-12'],
    data: [1, 3, 2, 3, 3.2, 4, 5],
    hover: ArrowToolTip
});

chart1.init();
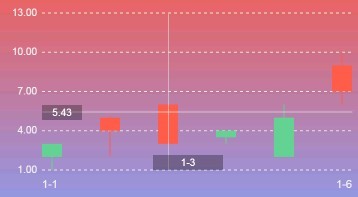
# K线图提示框KlineToolTip

- npm:
fundcharts/tooltips/grid - 适用图表:Kline
- 参数:如下表
| toolTip字段/说明 | 默认值 | 格式 | 说明 |
|---|---|---|---|
| xWidth | 70 | number | x轴提示框整体宽度 |
| xHeight | 15 | number | x轴提示框整体高度 |
| yWidth | 40 | number | y轴提示框整体宽度 |
| yHeight | 15 | number | y轴提示框整体高度 |
| font | 10px Arial | string | 文案样式 |
| color | #fff | string | 文案颜色 |
| textAlign | center | string | 文案对齐 |
| backgroundColor | #bdbdbd | string | 背景颜色 |
| showTip | '' | Function/string | 控制x轴的展示,函数时传参为xaxis数据。(xData: string) => {} |
| showValTip | '' | Function/string | 控制y轴的展示,函数时传参为计算出的data。(yData: number) => {} |
如:
const chart1 = new KlineChart({
    id: 'kline1',
    xaxis: ['1-1', '1-2', '1-3', '1-4', '1-5', '1-6'],
    datas: [
        [1, 2, 0.5, 2.1],
        [3, 4, 2, 4],
        [3, 5.5, 3, 6],
        [4.4, 3.5, 3, 5],
        [5, 6, 4, 7],
        [7, 3, 3, 7]
    ],
	font: {
        color: '#eee'
    },
    hoverLineColor: '#ddd',
    hover: KlineToolTip,
    toolTip: {
        backgroundColor: 'rgba(0,0,0,0.3)',
        color: '#fff'
    }
});
chart1.init();
# 饼图数据展示(中心)PieCenterToolTip
- npm:
fundcharts/tooltips/shape - 适用图表:Pie
- 参数:如下表
| toolTip字段/说明 | 默认值 | 格式 | 说明 |
|---|---|---|---|
| font | bold 22px consolas | string | 文案样式 |
| color | 对应区域颜色 | string | 文案颜色 |
| valColor | #fff | string | 数值文案颜色 |
| textAlign | center | string | 文案对齐 |
| valY | 圆心y坐标 | number | 文字中心y坐标 |
| showTip | '' | Function/string | 控制展示,函数时传参为索引。(index: number) => {} |
| showValTip | (val * 100).toFixed(1) | Function/string | 控制数据展示,函数时传参为对应data数据。(yDatas:number) => {} |
如:
const chart1Labels = [
    '吃饭',
    '睡觉',
    '打豆豆',
    '吃豆豆'
];
const chart1 = new PieChart({
    id: 'pie1',
    datas: [0.1, 0.2, 0.3, 0.4],
    hover: PieCenterToolTip,
    toolTip: {
        showTip (index) {
            return chart1Labels[index];
        }
    }
});

chart1.init();
# 饼图数据展示(连线边缘)PieLabelToolTip
- npm:
fundcharts/tooltips/shape - 适用图表:Pie
- 参数:如下表
| toolTip字段/说明 | 默认值 | 格式 | 说明 |
|---|---|---|---|
| font | bold 12px consolas | string | 文案样式 |
| color | 对应区域颜色 | string | 文案/连线颜色 |
| valColor | #fff | string | 数值文案颜色 |
| textAlign | center | string | 文案对齐 |
| showTip | '' | Function/string | 控制展示,函数时传参为索引。(index: number) => {} |
| showValTip | (val * 100).toFixed(1) | Function/string | 控制数据展示,函数时传参为对应data数据。(yDatas:number) => {} |
如:
const chart2 = new PieChart({
    id: 'pie2',
    annularRate: false,     // 实心(饼图)
    datas: [0.1, 0.2, 0.3, 0.2, 0.2],
    hover: PieLabelToolTip,
    toolTip: {
        showTip (index) {
            return chart1Labels[index];
        }
    }
});

chart2.init();
# label数据展示LabelsToolTip

- npm:
fundcharts/tooltips/shape - 适用图表:Pie/Radar
- 参数:如下表
| toolTip字段/说明 | 默认值 | 格式 | 说明 |
|---|---|---|---|
| font | bold 12px consolas | string | 文案样式 |
| color | 对应区域颜色 | string | 文案/连线颜色 |
| valColor | #fff | string | 数值文案颜色 |
| valX | 圆心x坐标 | number | 文字中心x坐标 |
| valY | 圆心y坐标 | number | 文字中心y坐标 |
| showTip | '' | Function/string | 控制展示,函数时传参为索引。(index: number) => {} |
| showValTip | (val * 100).toFixed(1) | Function/string | 控制数据展示,函数时传参为对应data数据。(yDatas:number) => {} |
如:
const chart1 = new RadarChart({
    id: 'radar1',
    data: [1, 2, 3, 4, 3.5, 3],
	hover: LabelsToolTip,
    toolTip: {
        showTip (index) {
            return ['吃', '喝', '玩', '乐', '代码', '书'][index]
        }
    }
});

chart1.init();
部分常见tooltip的绘制可见demo (opens new window)。