# 图形
目前包含折线图、面积图、饼图、环形图、柱状图、雷达图(蜘蛛图),散点图,K线图。
下列示例为web端,小程序/服务端的不同点详见小程序-与web端处理的不同点、服务端-与web端处理的不同点
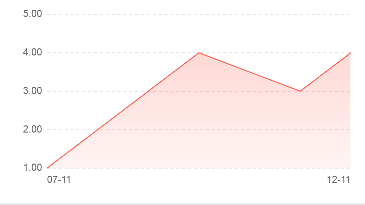
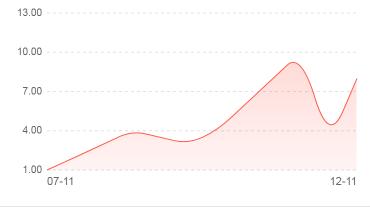
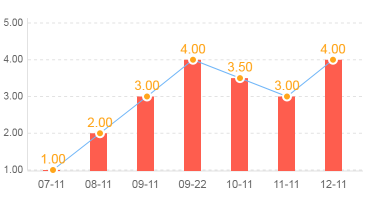
# 折线图/面积图:line
demo体验(请切为手机模式)>> (opens new window) CodePen体验>> (opens new window)
折线图默认第一条为渐变面积图,可通过设置
noGradient字段为纯折线图或通过allGradient设置为纯面积图。
# 准备工作
- 准备容器,需含id属性及配置宽高,如
<!-- 方式1 -->
<div id="chart" style="height: 2rem;"></div>

<!-- 方式2: 直接使用canvas元素(0.9.1起支持) -->
<canvas id="chart" width="375" height="200"></canvas>
- 准备构造函数
const LineChart = FundCharts.line
- x轴标签数组
- 数据项数组
# 实例化
必填字段:
| 字段 | 默认值 | 类型 | 说明 |
|---|---|---|---|
| id | -- | string | 容器id/0.9.1起支持canvas元素id |
| xaxis | -- | string[]/number[] | x轴标签数组 |
| datas | -- | array[number[]] | 数据项数组(0.9.1起不推荐单条使用data字段) 。如两条数据项[[1, 2, 3], [4, 5, 6]],单条[[1, 3, 5, 7, 9]] |
可选字段:
| 字段 | 默认值 | 类型 | 说明 |
|---|---|---|---|
| allGradient | false | boolean | 是否为面积图,默认第一条折线为面积图 |
| backgroundColor | 'rgba(0,0,0,0)' | string | 画布背景色。(v0.9.3及以前版本默认为'#fff') |
| chartLeft | 50 | number | 图表主要内容(图形区域)距左边距离,单位为px |
| chartRight | 15 | number | 图表主要内容(图形区域)距右边距离,单位为px |
| chartTop | 0 | number | 图表主要内容(图形区域)距顶部距离,单位为px |
duration(0.9.3起新增) | 600 | number | 动画执行时间,单位ms |
fontFamily(0.9.1起新增) | 'Arial' | string | 坐标文字字体 |
| handleTextX | -- | function | 自定义控制x轴坐标。(入参:ctx画布, xaxis数据,具体可见>>) |
| handleTextY | -- | function | 自定义控制y轴坐标。(入参:ctx画布, datas数据,具体可见>>) |
| yaxisfunc | -- | function | y轴单位显示处理(入参:data默认数据展示,返回需要展示的数据),如保留两位小数展示:data => data.toFixed(2) |
| colors | ['#fe5d4e', '#43c2f7', '#707ad9', '#3ba8ff', '#ffa92f'] | string[] | 折线颜色(六位十六进制) |
| noGradient | false | boolean | 无渐变面积效果(纯折线图) |
| noDash | false | boolean | 无虚线网格 |
| noHoverLine | false | boolean | 触控交互后不展示线条 |
| hideHoverPoints | false | boolean | 触控交互后不展示圆点 |
| noAnimation | false | boolean | 无动画过渡 |
| lineWidths | -- | number[] | 折线粗细数组,如[3, 1] |
| hover | -- | function | 交互返回函数(第一个参数为索引,number;第二个参数为对应数值集合,Array;第三个参数为x轴标签值;第四个参数为触控点的水平x坐标, number;第五个参数为触控点的水平y坐标(v0.9.3), number,具体可见>>) |
| hoverLineColor | '#999' | string | 触控后线条颜色 |
| onAnimation | -- | function | 动画执行时回调(入参:process动画进度,具体可见>>) |
| onFinish | -- | function | 动画结束后回调,具体可见>> |
| range | -- | object | 自定义极值范围,需包含min及max参数,如range: {min: 0, max: 15} |
events(0.9.1起新增) | ['touchstart', 'touchmove'] | string[] | 交互touch事件,传空数组[]即可实现无交互事件需求,传['mousemove']等可以实现PC鼠标事件交互 |
noHoverEvent(0.9.1起废弃) | false | boolean | 无交互事件 |
curveLine(0.9.2起新增) | false | boolean | 是否为曲线展示,注意开启此选项hover事件以及动画将无效 |
grid(0.9.3起新增) | {yTickLength: 5} | object | 网格控制,见下表grid具体字段 |
dash(0.9.3起新增) | {color: '#e2e2e2', length: 3} | object | 具体网格线展示配置,见下表dash具体字段 |
grid字段
| 字段 | 默认值 | 类型 | 说明 |
|---|---|---|---|
| showGrid | false | boolean | 是否展示x/y轴线 |
| color | '#e2e2e2' | string | 轴线颜色 |
| xTickLength | 0 | number | x轴网格数量 |
| yTickLength | 5 | number | y轴网格数量 |
dash字段
| 字段 | 默认值 | 类型 | 说明 |
|---|---|---|---|
| color | '#e2e2e2' | string | 网格线颜色 |
| length | 3 | number | 网格虚线单位长度 |
| isSolid | false | boolean | 网格线是否为实线 |
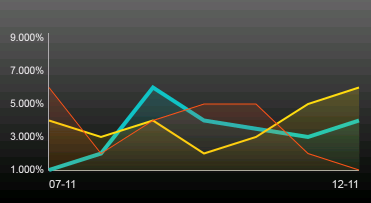
单条,如
const chart = new LineChart({
    id: 'chart',
    xaxis: ['09-11', '09-22', '10-11'],
    yaxisfunc (data) {
        return (data * 100).toFixed(2) + '%'
    },
    datas: [[1, 2, 3, 4]],	// 或设置为data: [1, 2, 3, 4], 但v0.9.1起不推荐
    colors: ['#0000ff'],
    hover (index, values, xaxis) {
        document.getElementById('showvalue').innerHTML = values[0];
        document.getElementById('showtime').innerHTML = xaxis;
    }
});

chart.init();
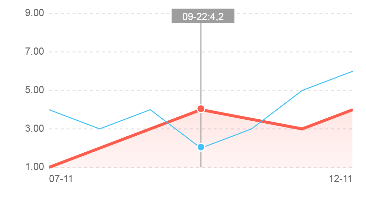
多条,如
const chart = new LineChart({
    id: 'chart',
    xaxis: ['09-11', '09-22', '10-11'],
    datas: [
        [1, 2, 3, 4],
        [1, 5, 3, 2]
    ],
    hover (index, values, xaxis) {
        document.getElementById('showvalue').innerHTML = values[0];
        document.getElementById('showvalue2').innerHTML = values[1];
        document.getElementById('showtime').innerHTML = xaxis;
    }
});

chart.init();
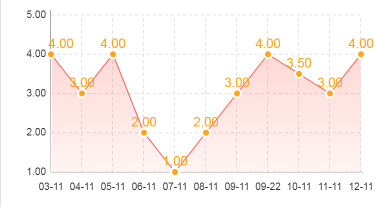
# 更新数据
update()方法
chart.update({
    xaxis: ['10-12', '10-23', '11-12', '11-23', '12-11'],
    datas: [
        [2, 4, 3, 2, 4],
        [3, 4, 5, 3, 5]
    ]
});
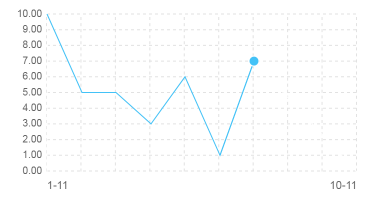
# 触摸事件及模拟
触摸事件目前默认支持移动端touchstart/touchmove事件,要在pc端运行可设置options.events参数,如{ events: ['mousemove'] }。
模拟触摸事件可通过调用实例的drawer.drawHover(x坐标)方法触发,
如:
setTimeout(() => {
    chart.drawer.drawHover(365);
}, 1000);
效果如:
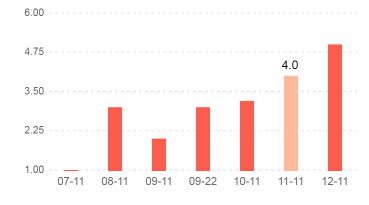
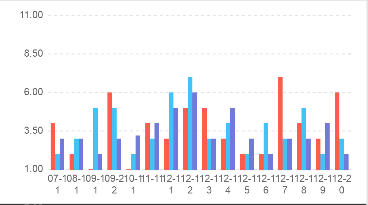
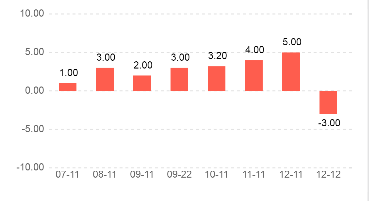
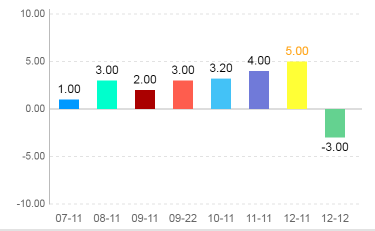
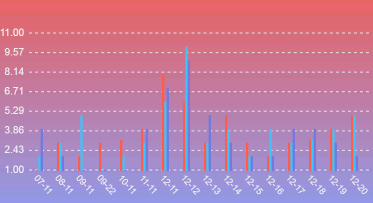
# 柱状图:bar
demo体验(请切为手机模式)>> (opens new window) CodePen体验>> (opens new window)
# 准备工作
- 准备容器,需含id属性及配置宽高,如
<!-- 方式1 -->
<div id="chart" style="height: 2rem;"></div>

<!-- 方式2: 直接使用canvas元素(0.9.1起支持) -->
<canvas id="chart" width="375" height="200"></canvas>
- 准备构造函数
const BarChart = FundCharts.bar
- x轴标签数组
- 数据项数组
# 实例化
必填字段:
| 字段 | 默认值 | 类型 | 说明 |
|---|---|---|---|
| id | -- | string | 容器id/0.9.1起支持canvas元素id |
| xaxis | -- | string[]/number[] | x轴标签数组 |
| datas | -- | array[number[]] | 数据项数组。如两条数据项[[1, 2, 3], [4, 5, 6]],单条数据项[[1, 3, 5, 7, 9]] |
可选字段:
| 字段 | 默认值 | 类型 | 说明 |
|---|---|---|---|
| barMargin | 60 | number | 柱形图之间间隔,单位为px |
| backgroundColor | 'rgba(0,0,0,0)' | string | 画布背景色。(v0.9.3及以前版本默认为'#fff') |
duration(0.9.3起新增) | 600 | number | 动画执行时间,单位ms |
fontFamily(0.9.1起新增) | 'Arial' | string | 坐标文字字体 |
| handleTextX | -- | function | 自定义控制x轴坐标。(入参:ctx画布, xaxis数据,具体可见>>) |
| handleTextY | -- | function | 自定义控制y轴坐标。(入参:ctx画布, datas数据,具体可见>>) |
| chartLeft | 50 | number | 图表主要内容(图形区域)距左边距离,单位为px |
| chartRight | 15 | number | 图表主要内容(图形区域)距右边距离,单位为px |
| chartTop | 0 | number | 图表主要内容(图形区域)距顶部距离,单位为px |
| colors | ['#fe5d4e', '#43c2f7', '#707ad9', '#3ba8ff', '#ffa92f'] | string[] | 折线颜色(六位十六进制) |
hover(0.9.1起新增) | -- | function | 交互返回函数(第一个参数为索引,number;第二个参数为对应数值集合,Array;第三个参数为x轴标签值,第四个参数为触控点的水平x坐标, number;第五个参数为触控点的水平y坐标(v0.9.3), number,具体可见>>) |
hoverHighlight(0.9.1起新增) | 0.6 | number | 交互区域高亮比例。 |
events(0.9.1起新增) | ['touchstart', 'touchmove'] | string[] | 交互touch事件,传空数组[]即可实现无交互事件需求,传['mousemove']等可以实现PC鼠标事件交互 |
| negativeColor | -- | string | 负值状态指定颜色 |
| noAnimation | false | boolean | 无动画过渡 |
| noDash | false | boolean | 无虚线网格 |
| onAnimation | -- | function | 动画执行时回调,具体可见>> |
| onFinish | -- | function | 动画结束后回调,具体可见>> |
| range | -- | object | 自定义范围,需包含min及max参数,如range: {min: 0, max: 15} |
grid(0.9.3起新增) | {yTickLength: 5} | object | 网格控制,见下表grid具体字段 |
dash(0.9.3起新增) | {color: '#e2e2e2', length: 3} | object | 具体网格线展示配置,见下表dash具体字段 |
isStack(0.9.6起新增) | false | boolean | 多数据项是否堆叠展示。 |
grid字段
| 字段 | 默认值 | 类型 | 说明 |
|---|---|---|---|
| showGrid | false | boolean | 是否展示x/y轴线 |
| color | '#e2e2e2' | string | 轴线颜色 |
| xTickLength | 0 | number | x轴网格数量 |
| yTickLength | 5 | number | y轴网格数量 |
dash字段
| 字段 | 默认值 | 类型 | 说明 |
|---|---|---|---|
| color | '#e2e2e2' | string | 网格线颜色 |
| length | 3 | number | 网格虚线单位长度 |
| isSolid | false | boolean | 网格线是否为实线 |
单条,如
const chart = new BarChart({
    id: 'chart',
    xaxis: ['09-11', '09-22', '10-11'],
    datas: [[1, 2, 3]], 	// 或设置为data: [1, 2, 3], 但v0.9.1起不推荐
});

chart.init();
多条,如
const chart = new BarChart({
    id: 'chart',
    xaxis: ['09-11', '09-22', '10-11', '11-22'],
    datas: [
        [1, 2, 3, 4],
        [1, 5, 3, 2],
        [5, 3, 4, 2]
    ],
    barMargin: 20
});

chart.init();
# 更新
update()方法
chart.update({
    xaxis: ['10-12', '10-23', '11-12', '11-23', '12-11'],
    datas: [
        [2, 4, 3, 2, 4],
        [3, 4, 5, 3, 5]
    ]
});
# 触摸事件及模拟
触摸事件目前默认支持移动端touchstart/touchmove事件,要在pc端运行可设置options.events参数,如{ events: ['mousemove'] }。
模拟触摸事件可通过调用实例的drawer.drawHover(x坐标)方法触发,
如:
setTimeout(() => {
    chart.drawer.drawHover(365);
}, 1000);
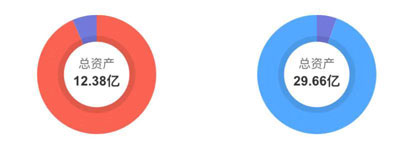
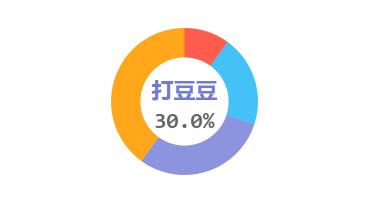
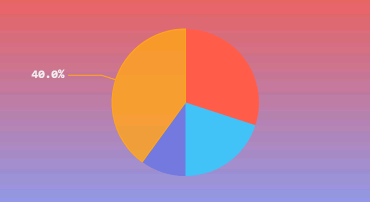
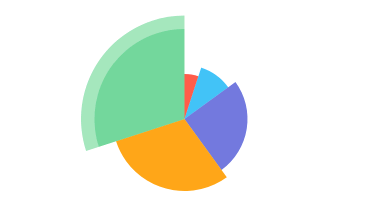
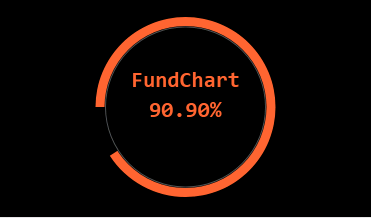
# 饼图/环形图:pie
demo体验(请切为手机模式)>> (opens new window) CodePen体验>> (opens new window)

# 准备工作
- 准备容器,需含id属性及配置宽高,如
<!-- 方式1 -->
<div id="chart" style="height: 2rem;"></div>

<!-- 方式2: 直接使用canvas元素(0.9.1起支持) -->
<canvas id="chart" width="375" height="200"></canvas>
- 准备构造函数
const PieChart = FundCharts.pie
- 比例数组
# 实例化
必填字段:
| 字段 | 默认值 | 类型 | 说明 |
|---|---|---|---|
| id | -- | string | 容器id/0.9.1起支持canvas元素id |
| datas | -- | number[] | 比例数组,请确认数组和为1。如[0.1, 0.3, 0.6] |
可选字段:
| 字段 | 默认值 | 类型 | 说明 |
|---|---|---|---|
| annularRate | 0.6 | number/boolean | 圆环空心比例(0或false时为饼图,其余为环形图) |
| backgroundColor | 'rgba(0,0,0,0)' | string | 画布背景色,建议环形图设置为不透明纯色。(v0.9.3及以前版本默认为'#fff') |
duration(0.9.3起新增) | 600 | number | 动画执行时间,单位ms |
| radius | -- | number | 饼图直径,默认取画布高度height/20 - 20 |
startAngle(0.9.3起新增) | -0.5 * Math.PI | number | 起始角度 |
| origin | -- | object | 圆心坐标{x: 水平坐标, y: 垂直坐标} |
| colors | ['#fe5d4e', '#43c2f7', '#707ad9', '#3ba8ff', '#ffa92f'] | string[] | 各区域颜色(六位十六进制) |
| lineWidth | 0 | number | 饼图/环形图各区域之间空隙(需要配置画布背景色backgroundColor) |
| widthRates | null | number[] | 各饼图半径比例,范围0~1,(可用于做蝴蝶图) |
hover(0.9.1起新增) | -- | function | 交互返回函数(第一个参数为索引,number;第二个参数为对应数值集合,Array;第三个参数触控点对应中心坐标的角度,number;第四个参数为触控点的水平x坐标,number;第五个参数为触控点的水平y坐标, number,具体可见>>) |
hoverHighlight(0.9.1起新增) | 0.6 | number | 交互区域高亮比例。 |
hoverRate(0.9.1起新增) | 1 | number | 交互高亮区域半径 |
events(0.9.1起新增) | ['touchstart', 'touchmove'] | string[] | 交互touch事件,传空数组[]即可实现无交互事件需求,传['mousemove']等可以实现PC鼠标事件交互 |
| noAnimation | false | boolean | 无动画过渡 |
| onAnimation | -- | function | 动画执行时回调,具体可见>> |
| onFinish | -- | function | 动画结束后回调,具体可见>> |
如
const chart = new PieChart({
    id: 'chart',
    datas: [0.1, 0.2, 0.3, 0.4],
    colors: ['#0000ff'],
});

chart.init();
# 更新数据
update()方法
chart.update({
    datas: [0.4, 0.3, 0.2, 0.1]
});
# 触摸事件及模拟
触摸事件目前默认支持移动端touchstart/touchmove事件,要在pc端运行可设置options.events参数,如{ events: ['mousemove'] }。
模拟触摸事件可通过调用实例的drawer.drawHover(x坐标, y坐标)方法触发,
如:
setTimeout(() => {
    chart.drawer.drawHover(365, 100);
}, 1000);
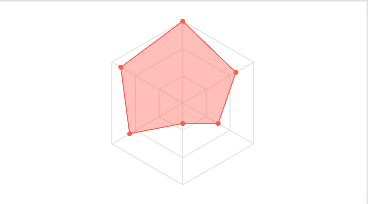
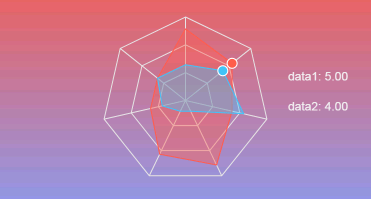
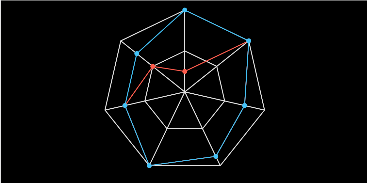
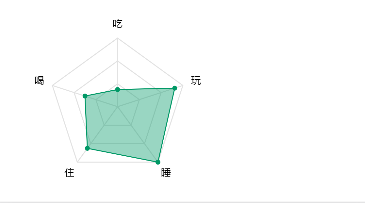
# 雷达图(蜘蛛图):radar
demo体验(请切为手机模式)>> (opens new window) CodePen体验 (opens new window)
# 准备工作
- 准备容器,需含id属性及配置宽高,如
<!-- 方式1 -->
<div id="chart" style="height: 2rem;"></div>

<!-- 方式2: 直接使用canvas元素(0.9.1起支持) -->
<canvas id="chart" width="375" height="200"></canvas>
- 准备构造函数
const RadarChart = FundCharts.radar
- 数据项数组
# 1.4.2 实例化
必填字段:
| 字段 | 默认值 | 类型 | 说明 |
|---|---|---|---|
| id | -- | string | 容器id/0.9.1起支持canvas元素id |
| datas | -- | array[number[]] | 数据项数组(0.9.1起不推荐单条使用data字段),如单条数据项[[1, 3, 5, 2, 5]],两条数据项[[1, 2, 3], [3, 2, 1]] |
可选字段:
| 字段 | 默认值 | 类型 | 说明 |
|---|---|---|---|
| backgroundColor | 'rgba(0,0,0,0)' | string | 画布背景色。(v0.9.3及以前版本默认为'#fff') |
| radius | -- | number | 雷达图直径,默认取画布高度height/20 - 20 |
| origin | -- | object | 圆心坐标{x: 水平坐标, y: 垂直坐标} |
| colors | ['#fe5d4e', '#43c2f7', '#707ad9', '#3ba8ff', '#ffa92f'] | string[] | 折线颜色(六位十六进制) |
duration(0.9.3起新增) | 600 | number | 动画执行时间,单位ms |
| noAnimation | false | boolean | 无动画过渡 |
| noFill | false | boolean | 无填充色 |
| fillGrid | '' | string | 背景网格设置填充色 |
| gridNumber | 3 | number | 背景网格线数量,>=1 |
| maxRate | 0.9 | number | 数据点最高比例,0~1,为1时最大数据点贴边 |
| hidePoints | false | boolean | 隐藏边角点 |
hover(0.9.1起新增) | -- | function | 交互返回函数(第一个参数为索引,number;第二个参数为对应数值集合,Array;第三个参数触控点对应中心坐标的角度,number;第四个参数为触控点的水平x坐标,number;第五个参数为触控点的水平y坐标, number,具体可见>>) |
hoverHighlight(0.9.1起新增) | 0.6 | number | 交互区域高亮比例。 |
events(0.9.1起新增) | ['touchstart', 'touchmove'] | string[] | 交互touch事件,传空数组[]即可实现无交互事件需求,传['mousemove']等可以实现PC鼠标事件交互 |
| onAnimation | -- | function | 动画执行时回调,具体可见>> |
| onFinish | -- | function | 动画结束后回调,具体可见>> |
单条,如
const chart = new RadarChart({
    id: 'chart',
    datas: [[1, 2, 3, 4, 3.5, 3]]	// 或设置为data: [1, 2, 3, 4, 3.5, 3], 但v0.9.1起不推荐
});

chart.init();
多条,如
const chart = new RadarChart({
    id: 'chart',
    xaxis: ['09-11', '09-22', '10-11', '11-22'],
    datas: [
        [1, 2, 3, 4, 3.5, 3, 4],
        [4, 3, 3, 4, 3.5, 3, 4]
    ]
});

chart.init();
# 更新
update()方法
chart.update({
    datas: [
        [2, 4, 3, 2, 4],
        [3, 4, 5, 3, 5]
    ]
});
# 触摸事件及模拟
触摸事件目前默认支持移动端touchstart/touchmove事件,要在pc端运行可设置options.events参数,如{ events: ['mousemove'] }。
模拟触摸事件可通过调用实例的drawer.drawHover(x坐标, y坐标)方法触发,
如:
setTimeout(() => {
    chart.drawer.drawHover(365, 100);
}, 1000);
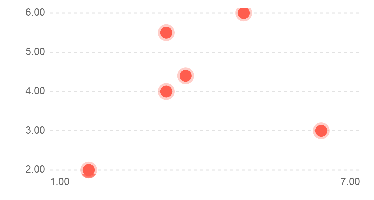
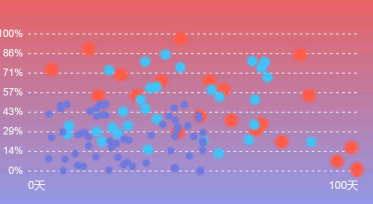
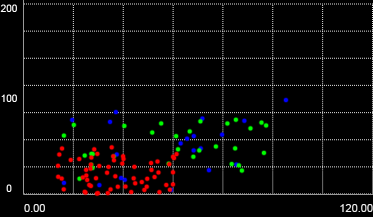
# 散点图:scatter
demo体验(请切为手机模式)>> (opens new window) CodePen体验>> (opens new window)
# 准备工作
- 准备容器,需含id属性及配置宽高,如
<!-- 方式1 -->
<div id="chart" style="height: 2rem;"></div>

<!-- 方式2: 直接使用canvas元素(0.9.1起支持) -->
<canvas id="chart" width="375" height="200"></canvas>
- 准备构造函数
const ScatterChart = FundCharts.scatter
- 数据项数组
# 实例化
必填字段:
| 字段 | 默认值 | 类型 | 说明 |
|---|---|---|---|
| id | -- | string | 容器id/0.9.1起支持canvas元素id |
| datas | -- | array[array[number[]]] | 数据项数组(0.9.1起不推荐单条使用data字段),如两条数据项[[[1, 3], [2, 2]], [[4, 5], [3, 4]]],单条数据项[[[1, 3], [2, 4]]] |
可选字段:
| 字段 | 默认值 | 类型 | 说明 |
|---|---|---|---|
| backgroundColor | 'rgba(0,0,0,0)' | string | 画布背景色。(v0.9.3及以前版本默认为'#fff') |
borderRate(0.9.4起新增) | 0.8 | number | 圆点边框相较于圆点半径的宽度比例 |
| chartLeft | 50 | number | 图表主要内容(图形区域)距左边距离,单位为px |
| chartRight | 15 | number | 图表主要内容(图形区域)距右边距离,单位为px |
| chartTop | 0 | number | 图表主要内容(图形区域)距顶部距离,单位为px |
duration(0.9.3起新增) | 600 | number | 动画执行时间,单位ms |
fontFamily(0.9.1起新增) | 'Arial' | string | 坐标文字字体 |
| handleTextX | -- | function | 自定义控制x轴坐标。(入参:ctx画布, xaxis数据,具体可见>>) |
| handleTextY | -- | function | 自定义控制y轴坐标。(入参:ctx画布, datas数据,具体可见>>) |
| xaxisfunc | -- | function | x轴单位显示处理(入参:data默认数据展示,返回需要展示的数据),如保留两位小数展示:data => data.toFixed(2) |
| yaxisfunc | -- | function | y轴单位显示处理(入参:data默认数据展示,返回需要展示的数据),如保留两位小数展示:data => data.toFixed(2)) |
| colors | ['#fe5d4e', '#43c2f7', '#707ad9', '#3ba8ff', '#ffa92f'] | string[] | 点的颜色(六位十六进制) |
| noAnimation | false | boolean | 无动画过渡 |
| noDash | false | boolean | 无虚线网格 |
| onAnimation | -- | function | 动画执行时回调,具体可见>> |
| onFinish | -- | function | 动画结束后回调,具体可见>> |
| pointWidths | [6... ] | number[] | 散点半径(不包括描边) |
| noPointSide | false | boolean | 散点无描边 |
| range | -- | object | 自定义范围,需包含x及y参数,如range: {x: [0, 10], y: [1, 15]} |
grid(0.9.3起新增) | {yTickLength: 5} | object | 网格控制,见下表grid具体字段 |
dash(0.9.3起新增) | {color: '#e2e2e2', length: 3} | object | 具体网格线展示配置,见下表dash具体字段 |
grid字段
| 字段 | 默认值 | 类型 | 说明 |
|---|---|---|---|
| showGrid | false | boolean | 是否展示x/y轴线 |
| color | '#e2e2e2' | string | 轴线颜色 |
| xTickLength | 0 | number | x轴网格数量 |
| yTickLength | 5 | number | y轴网格数量 |
dash字段
| 字段 | 默认值 | 类型 | 说明 |
|---|---|---|---|
| color | '#e2e2e2' | string | 网格线颜色 |
| length | 3 | number | 网格虚线单位长度 |
| isSolid | false | boolean | 网格线是否为实线 |
单项,如
const chart1 = new ScatterChart({
    id: 'scatter1',
    datas: [		// 或设置为data: [[1, 2], [3, 4], [3, 5.5], [3.5, 4.4], [5, 6], [7, 3]], 但v0.9.1起不推荐
		[
			[1, 2],
			[3, 4],
			[3, 5.5],
			[3.5, 4.4],
			[5, 6],
			[7, 3]
		]
    ]
});

chart1.init();
多项,如
const chart2 = new ScatterChart({
    id: 'scatter2',
    datas: [
        [
            [1, 2],
            [3, 4],
            [3, 5.5],
            [3.5, 4.4],
            [5, 6],
            [7, 3]
        ],
        [
            [8, 7],
            [7, 6],
            [3, 5.5],
            [3.5, 4.4],
            [5, 6],
            [7, 3],
            [1, 3]
        ]
    ]
});

chart2.init();
# 更新
update()方法
chart.update({
    xaxis: ['10-12', '10-23', '11-12', '11-23', '12-11'],
    datas: [
        [2, 4, 3, 2, 4],
        [3, 4, 5, 3, 5]
    ]
});
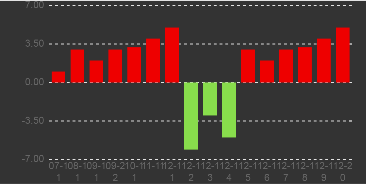
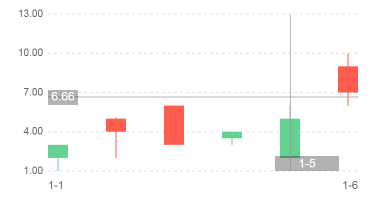
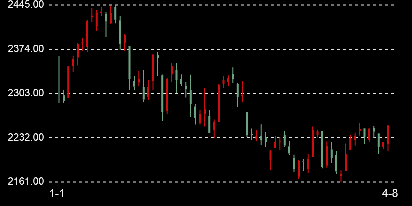
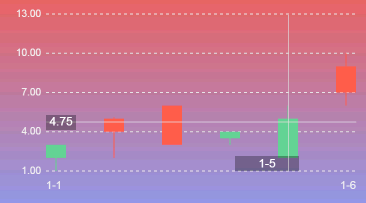
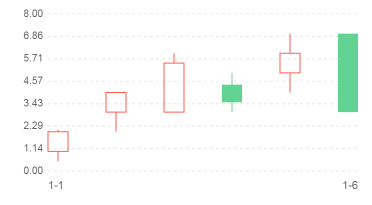
# k线图:kline
demo体验(请切为手机模式)>> (opens new window) CodePen体验>> (opens new window)
# 准备工作
- 准备容器,需含id属性及配置宽高,如
<!-- 方式1 -->
<div id="chart" style="height: 2rem;"></div>

<!-- 方式2: 直接使用canvas元素(0.9.1起支持) -->
<canvas id="chart" width="375" height="200"></canvas>
- 准备构造函数
const KlineChart = FundCharts.kline
- x轴标签数组
- 数据项数组
# 实例化
必填字段:
| 字段 | 默认值 | 类型 | 说明 |
|---|---|---|---|
| id | -- | string | 容器id/0.9.1起支持canvas元素id |
| xaxis | -- | string[]/number[] | x轴标签数组 |
| datas | -- | array[number[]] | 数据项数组 |
可选字段:
| 字段 | 默认值 | 类型 | 说明 |
|---|---|---|---|
| backgroundColor | 'rgba(0,0,0,0)' | string | 画布背景色。(v0.9.3及以前版本默认为'#fff') |
| chartLeft | 50 | number | 图表主要内容(图形区域)距左边距离,单位为px |
| chartRight | 15 | number | 图表主要内容(图形区域)距右边距离,单位为px |
| chartTop | 0 | number | 图表主要内容(图形区域)距顶部距离,单位为px |
duration(0.9.3起新增) | 600 | number | 动画执行时间,单位ms |
fontFamily(0.9.1起新增) | 'Arial' | string | 坐标文字字体 |
| handleTextX | -- | function | 自定义控制x轴坐标。(入参:ctx画布, xaxis数据,具体可见>>) |
| handleTextY | -- | function | 自定义控制y轴坐标。(入参:ctx画布, datas数据,具体可见>>) |
| yaxisfunc | -- | function | y轴单位显示处理(入参:data默认数据展示,返回需要展示的数据),如保留两位小数展示:data => data.toFixed(2)) |
| colors | ['#fe5d4e', '#43c2f7', '#707ad9', '#3ba8ff', '#ffa92f'] | string[] | 阴/阳线的颜色(六位十六进制),阳线为colors[0],阴线为colors[4],可通过调换颜色色值实现反转 |
| noAnimation | false | boolean | 无动画过渡 |
| noDash | false | boolean | 无虚线 |
hover(0.9.1起新增) | -- | function | 交互返回函数(第一个参数为索引,number;第二个参数为对应数值集合,Array;第三个参数为x轴标签值,number;第四个参数为触控点的水平x坐标,number;第五个参数为触控点的水平y坐标, number,具体可见>>) |
events(0.9.1起新增) | ['touchstart', 'touchmove'] | string[] | 交互touch事件,传空数组[]即可实现无交互事件需求,传['mousemove']等可以实现PC鼠标事件交互 |
hoverLineColor(0.9.1起新增) | '#999' | string | 触控后线条颜色 |
| onAnimation | -- | function | 动画执行时回调,具体可见>> |
| onFinish | -- | function | 动画结束后回调,具体可见>> |
| range | -- | object | 自定义极值范围,需包含min及max参数,如range: {min: 0, max: 15} |
upHollow(0.9.2起新增) | false | boolean | 上涨是否展示为空心矩形(默认为实心) |
grid(0.9.3起新增) | {yTickLength: 5} | object | 网格控制,见下表grid具体字段 |
dash(0.9.3起新增) | {color: '#e2e2e2', length: 3} | object | 具体网格线展示配置,见下表dash具体字段 |
grid字段
| 字段 | 默认值 | 类型 | 说明 |
|---|---|---|---|
| showGrid | false | boolean | 是否展示x/y轴线 |
| color | '#e2e2e2' | string | 轴线颜色 |
| xTickLength | 0 | number | x轴网格数量 |
| yTickLength | 5 | number | y轴网格数量 |
dash字段
| 字段 | 默认值 | 类型 | 说明 |
|---|---|---|---|
| color | '#e2e2e2' | string | 网格线颜色 |
| length | 3 | number | 网格虚线单位长度 |
| isSolid | false | boolean | 网格线是否为实线 |
如
const chart1 = new KlineChart({
    id: 'kline1',
    xaxis: ['1-1', '1-2', '1-3', '1-4', '1-5', '1-6'],
    datas: [
        [1, 2, 0.5, 2.1],
        [3, 4, 2, 4],
        [3, 5.5, 3, 6],
        [4.4, 3.5, 3, 5],
        [5, 6, 4, 7],
        [7, 3, 3, 7]
    ]
});

chart1.init();
# 更新
update()方法
chart.update({
    xaxis: ['10-12', '10-23', '11-12', '11-23', '12-11'],
    datas: [
        [3, 2, 1, 2.1],
        [4, 5, 2, 5.1],
        [3, 6, 3, 6],
        [4, 3.5, 3, 4],
        [5, 2, 2, 6],
        [7, 9, 6, 10]
    ]
});
# 触摸事件及模拟
触摸事件目前默认支持移动端touchstart/touchmove事件,要在pc端运行可设置options.events参数,如{ events: ['mousemove'] }。
模拟触摸事件可通过调用实例的drawer.drawHover(x坐标, y坐标)方法触发,
如:
setTimeout(() => {
    chart.drawer.drawHover(365, 100);
}, 1000);
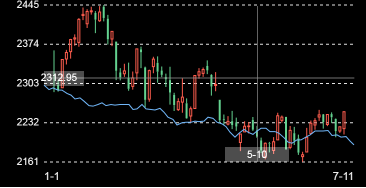
# 图形合并
demo体验(请切为手机模式)>> (opens new window) CodePen体验>> (opens new window)
支持部分图形的组合绘制,v0.9.3起支持。
← 开始 交互提示ToolTips →