# 小程序端
# 与web端处理的不同点
小程序的使用跟web端类似,只有如下几点不同的地方。
# 1.二次绘制必须调用ctx.draw(true)方法。
与web不同,小程序的二次绘制要在最后调用ctx.draw(true) (opens new window)方法绘制,其中参数true是保证在原有图形的基础上绘制。
# 2.必须设置width、height参数
小程序环境无法获取原生canvas的宽高,因此为保持形状不变形,需要设置参数width/height为canvas的宽高,如
chartInit = new LineChart({
    id: 'chart',
    xaxis: ['09-11', '09-22', '10-11'],
    yaxisfunc(data) {
    return (data * 100).toFixed(2) + '%'
    },
    Ctx: ctx,
    width: 375,    // 设置宽度
    height: 212,    // 设置高度
    xaxis: ['07-11', '08-11', '09-11', '09-22', '10-11', '11-11', '12-11'],
    datas: [
		[1, 2, 3, 4, 3.5, 3, 4],
		[4, 3, 4, 2, 3, 5, 6]
    ]
});

chartInit.init();
# 3.涉及到交互需要主动设定绑定事件
小程序环境无法通过添加动作事件来完成交互的展示,因此比起web需要多一些绑定的操作,如
<!-- wxml -->
<canvas
    style="width: 375px; height: 212px;"
    canvas-id="chart"
    bindtouchstart="chartTouchstart"
    bindtouchmove="chartTouchmove"
></canvas>
let chartInit = null;

    //...
        onLoad () {
            chartInit = new LineChart({
              id: 'chart',
              xaxis: ['09-11', '09-22', '10-11'],
              yaxisfunc(data) {
                return (data * 100).toFixed(2) + '%'
              },
              Ctx: ctx,
              width: 375,
              height: 212,
              xaxis: ['07-11', '08-11', '09-11', '09-22', '10-11', '11-11', '12-11'],
              data: [1, 2, 3, 4, 3.5, 3, 4]
            });

            chartInit.init();
        },

        // touch start
        chartTouchstart: function (e) {
            if (e) {
              let event = e.touches[0];
              chartInit.drawer.drawHover(event.x, event.y);        // 折线图的hover处理
            }
        },
        // touch move
        chartTouchmove: function (e) {
            if (e) {
              let event = e.touches[0];
              chartInit.drawer.drawHover(event.x, event.y);
            }
        },
    //...
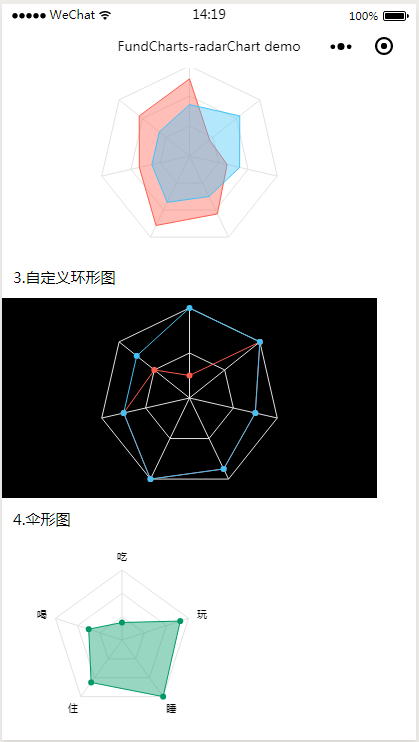
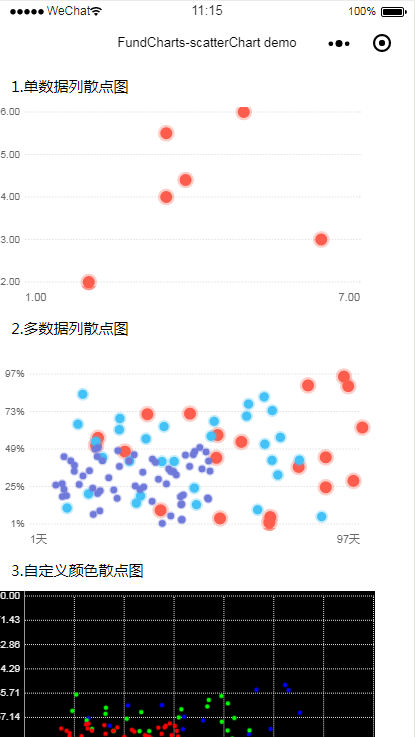
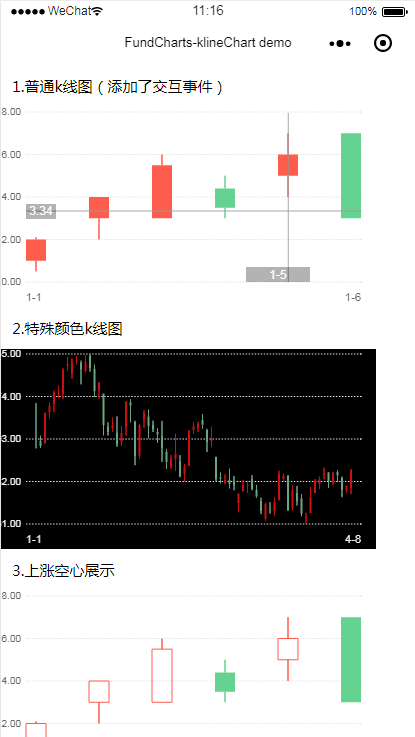
# demos
← 二次绘制 服务端(nodejs) →